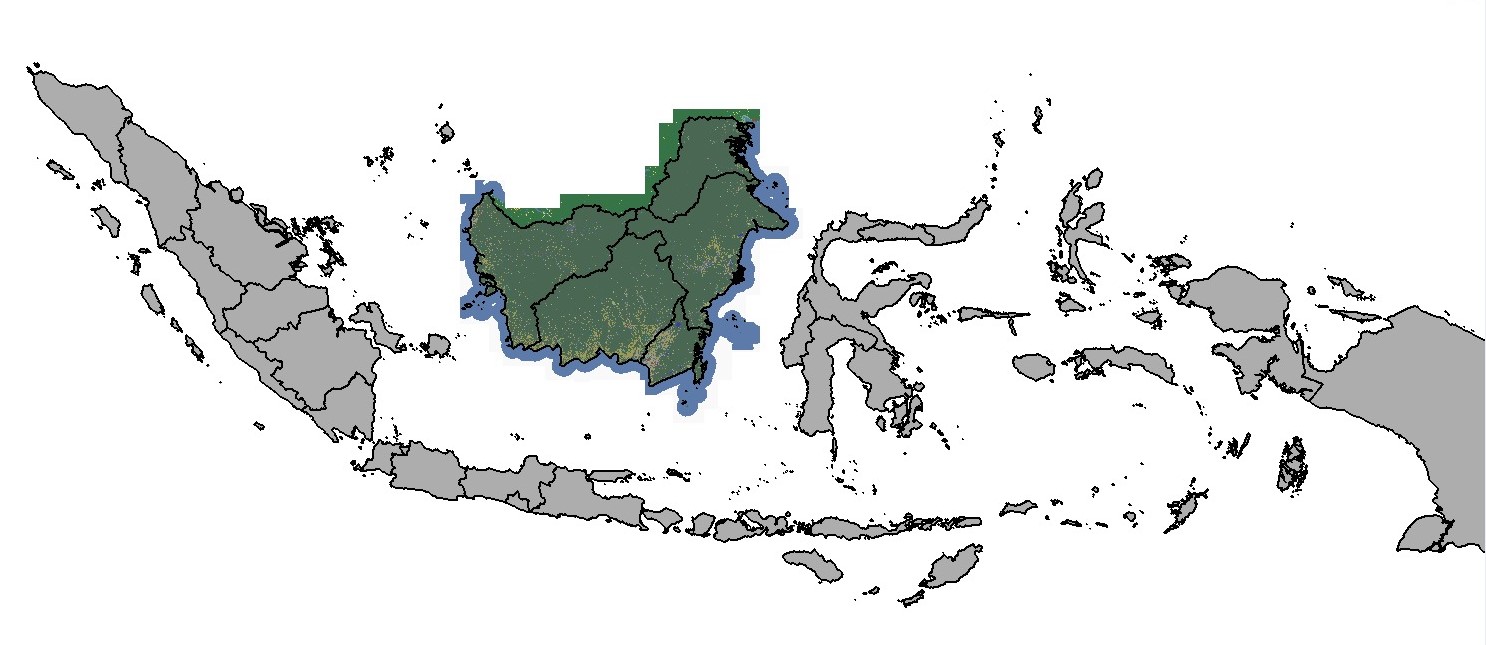
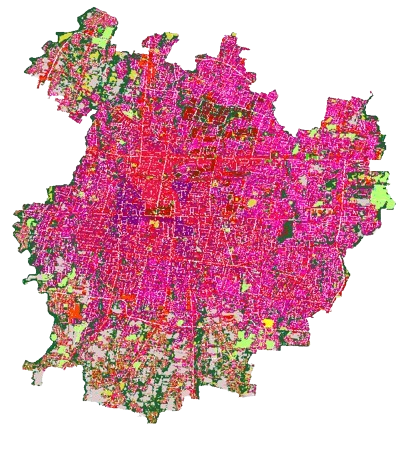
Our Specialties

Our digital maps are offered based on the specific geographic features they cover and the total area to be covered

Nations or Regions

Region Planner medium resolution 10-50 meter provide a comprehensive view of terrain and clutter over vast areas including entire countries with integrated layers such as a digital terrain model (DTM), clutter and linear vectors.

Urban

Urban Planner provides medium-to-high 5-10 meter resolution  databases with precise and current terrain, clutter, vector data, and orthoimagery. These datasets enable highly accurate propagation modeling for 3G and 4G network planning

City

City Planner is a high-resolution 1-5 meter designed 5G network. It offers a precise height model of the terrain and  buildings. Making it an ideal tool for visualizing network connectivity to target customers and supporting detailed 5G planning efforts.

Clutter Class Map

A clutter class map is a type of geographical representation used to classify and depict various types of land use and environmental features within a specific area. It categorizes the landscape into different “clutter” types, which typically include natural elements like forests, water bodies, and grasslands, as well as human-made structures such as urban areas, roads, and agricultural fields. These maps are essential in understanding how land is utilized and how different environmental features are distributed across a region.

The purpose of a clutter class map is to provide a detailed overview of the terrain’s characteristics, helping in various applications such as urban planning, environmental monitoring, and telecommunications. For instance, in the context of telecommunications, clutter maps are crucial for signal propagation modeling, as different land cover types can significantly affect the strength and reach of radio signals. By understanding the distribution of different clutter types, engineers can better design and optimize communication networks.

Height Map

A height map is a specialized type of digital map that represents the elevation of the earth’s surface in detail. It provides a visual depiction of topography, showing variations in terrain such as hills, valleys, mountains, and flat areas. In addition to natural features, a height map can also include man-made structures like buildings, which adds another layer of detail by showing the height and shape of these structures relative to the surrounding landscape.

Including building heights in a height map is particularly useful in urban planning, architectural design, and telecommunications. For example, in urban areas, these maps help planners understand the impact of building heights on sunlight exposure, wind patterns, and viewsheds. In telecommunications, they are used to model and predict how buildings might obstruct or reflect signals, helping to optimize the placement of antennas and other infrastructure. Overall, height maps are essential tools for accurately modeling and analyzing both natural and built environments.

Population Map

Our high-resolution population map is a detailed representation of population density across a specific area, providing critical insights into where people live and how densely populated different regions are. These maps are particularly valuable in identifying areas with high traffic demand, which are essential for planning the expansion and densification of wireless networks. By pinpointing areas with higher population concentrations, network planners can strategically deploy infrastructure, such as cell towers, to ensure optimal coverage and capacity where it is needed most.

The Population Distribution Model plays a crucial role in wireless network planning. This model allows for the analysis of population distribution at varying levels of detail, from broad countrywide perspectives down to individual cities. By processing these values, PopMap helps network planners make informed decisions on where to enhance network capacity and coverage, ensuring that wireless services meet the demands of the population efficiently. This approach is vital for delivering reliable and high-quality wireless connectivity in both urban and rural areas.

Building Height Map

Our high-resolution building height map is a detailed digital representation that shows the variations in building heights across a specific area. This type of map provides a clear and precise view of how tall buildings are, allowing users to see the differences in height from one structure to another. 

These maps are particularly useful in urban planning, architecture, and telecommunications. For example, urban planners and architects can use building height maps to assess how new constructions might affect the skyline, impact natural light, or influence wind flow in a city.

In telecommunications, these maps help in designing and optimizing wireless networks by identifying potential obstacles that could block or reflect signals, such as taller buildings. Overall, a high-resolution building height map provides an essential tool for understanding and managing the built environment in a detailed and informed manner


Building Polygon

Our building footprint polygon is a geometric representation of a building’s outline or perimeter on the ground, typically shown on a map. These polygons provide a precise view of the spatial distribution of buildings across a specific area, showing the exact location, shape, and size of each building’s base. Our building footprints are more completed than OSM map. Buildings shapes polygons are created using an automated production process of object recognition from high-resolution satellite images.

Building footprint polygons are invaluable in various applications, such as urban planning, disaster management, and infrastructure development. Urban planners use them to understand the density and arrangement of buildings within a city, which helps in zoning decisions, infrastructure planning, and optimizing land use. In disaster management, these polygons help assess potential impacts by identifying which buildings are in vulnerable areas, such as flood zones. By showing the spatial distribution of buildings, footprint polygons enable detailed analysis and decision-making processes related to the development and management of urban and rural spaces.

Population Distribution Polygon

Our population distribution polygon map is a geographical tool that visually represents how people are spread across a given area. This polygon is an essential tool for analyzing demographic patterns. The map divides the region into polygons, which are typically based on administrative boundaries like cities, neighborhoods. Each polygon indicates the population within that specific area, allowing for a detailed understanding of where people live and how densely populated different regions are.

This type of map is particularly useful for identifying patterns of population concentration and distribution. For instance, it can highlight densely populated urban centers, suburban areas with moderate population densities, and sparsely populated rural regions. By showing how populations are spread out across the landscape, these maps are valuable for urban planning, infrastructure development, and resource allocation, as they help planners and decision-makers target areas with specific needs based on their population characteristics.